

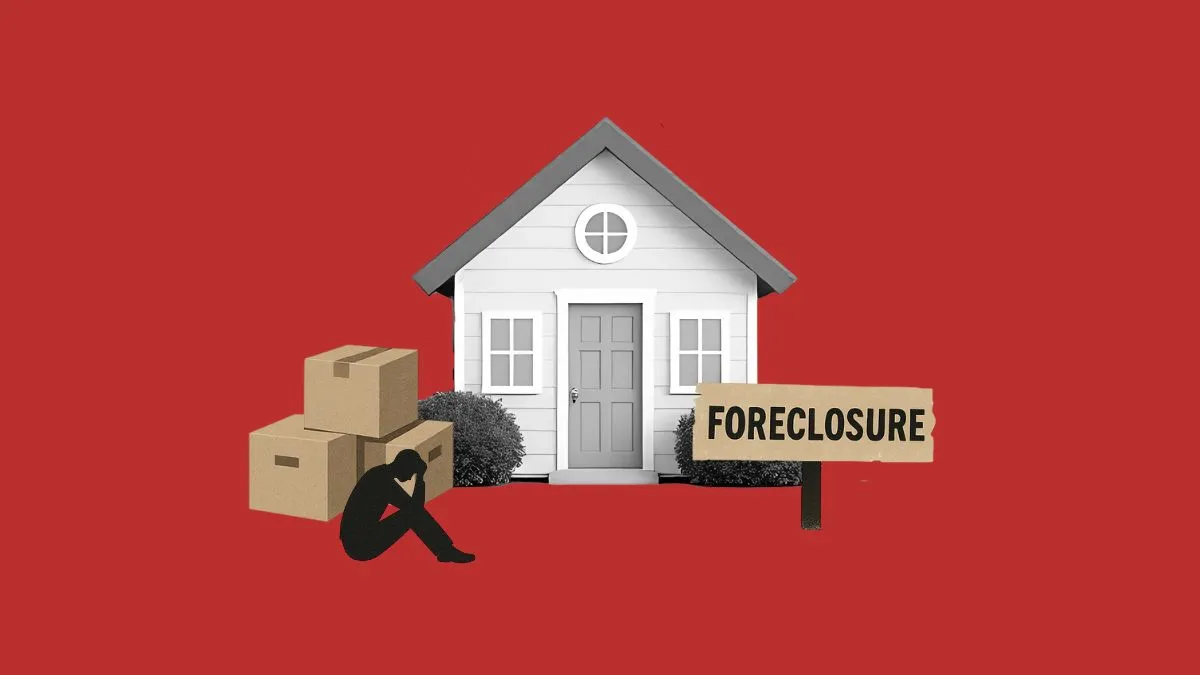
Recent data indicating a 21% year-over-year increase in foreclosure filings has sparked a wave of concern across financial news outlets and social media platforms, leading to widespread speculation regarding a potential collapse of the American housing market. This narrative, often characterized by market analysts as "foreclosure alarmism," suggests that the U.S. is on the precipice of a housing crisis reminiscent of the 2008 Great Financial Crisis. However, a comprehensive examination of the underlying data, historical context, and current legislative safeguards reveals a market that is fundamentally different from the one that collapsed nearly two decades ago. While the nominal percentage increase in foreclosures appears significant, it represents a transition from historic lows back toward pre-pandemic norms rather than a systemic failure of the credit market.
The current discourse was accelerated by high-profile commentary, including statements from former presidential candidate Andrew Yang, who suggested on the social media platform X that the "pain is spreading to homeowners" and that the current foreclosure rate is the highest in seven years. Such assertions, while grounded in specific data points, often lack the broader context of inventory levels, homeowner equity, and the stringent lending standards currently in place. To understand the true state of the market, it is necessary to look beyond headlines and analyze the structural integrity of modern American household debt.
Statistical Context: Analyzing the 21% Year-Over-Year Increase
The 21% increase in foreclosure activity reported by data providers such as ATTOM must be viewed through the lens of the "base effect." During the COVID-19 pandemic, the federal government implemented a series of foreclosure moratoriums and forbearance programs that effectively halted the legal process of property seizure for several years. Consequently, foreclosure filings reached record lows during 2020 and 2021. As these temporary protections expired and the legal system worked through a multi-year backlog, a year-over-year increase was statistically inevitable.
According to the New York Federal Reserve’s quarterly Household Debt and Credit Report, current delinquency rates remain well within historical norms. Traditionally, between 1% and 4% of mortgage loans are in some stage of delinquency at any given time. During the 2008 crisis, this figure surged as a result of predatory lending and a subsequent job-loss recession. In contrast, the current uptick represents a normalization process. The "flow" of new foreclosures is significantly lower than the "stock" of healthy mortgages, with over 162 million Americans currently employed and maintaining their debt obligations.
Historical Chronology: Comparing the 2008 Collapse to the 2024 Market
The most frequent comparison made by proponents of a housing crash is the era leading up to 2008. However, the chronology of that crisis began with a massive credit boom between 2002 and 2005, characterized by subprime lending and "toxic" loan products. By 2005, bankruptcy filings were already rising, and foreclosures began to climb steadily in 2006 and 2007, well before the broader economy entered a recession.
In 2007, the U.S. housing market was saturated with 4 million active listings, creating a massive oversupply. Today, the market holds approximately 1.56 million active listings. Normal, balanced market levels typically range between 2 million and 2.5 million listings. The current scarcity of inventory acts as a natural floor for home prices. For a foreclosure crisis to trigger a price crash, there would need to be a massive influx of distressed properties hitting the market simultaneously—a scenario that is currently unsupported by listing data. During the housing bubble, new listings frequently ranged from 250,000 to 400,000 per week; currently, even during seasonal peaks, new listings struggle to surpass the 100,000 mark.
The Role of Legislative Safeguards: Dodd-Frank and the QM Rule
One of the primary reasons the current market remains resilient is the legislative overhaul that followed the 2008 crisis. Two critical pieces of legislation have fundamentally altered the credit profile of the American homeowner: the Bankruptcy Abuse Prevention and Consumer Protection Act of 2005 and the Dodd-Frank Wall Street Reform and Consumer Protection Act of 2010.
Under Dodd-Frank, the Consumer Financial Protection Bureau (CFPB) introduced the "Qualified Mortgage" (QM) rule in 2014. This rule mandates that lenders must make a reasonable, good-faith determination of a consumer’s ability to repay a mortgage. It prohibited many of the risky features that led to the previous crash, such as "interest-only" periods, "negative amortization" where the principal balance increases, and "balloon payments." As a result, the vast majority of mortgages issued in the last decade are 30-year fixed-rate loans held by borrowers with high credit scores. This eliminates the "payment shock" that occurred in 2008 when adjustable-rate mortgages (ARMs) reset to significantly higher monthly payments.
Homeowner Equity: A Buffer Against Distressed Sales
Perhaps the most significant difference between the current era and the Great Financial Crisis is the amount of equity held by homeowners. In 2010, more than 23% of all mortgaged homes in the U.S. were "underwater," meaning the owners owed more than the property was worth. This lack of equity left homeowners with no choice but to default when they faced financial hardship, as they could not sell the home to cover the debt.
Today, the situation is reversed. Approximately 40% of U.S. homes are owned "free and clear," with no mortgage debt at all. For those with mortgages, the aggregate Loan-to-Value (LTV) ratio is approximately 45.1%, a stark contrast to the 85% LTV levels seen in 2008. Because homeowners have massive amounts of "nested equity," they have options. If a homeowner faces financial distress today, they are more likely to sell the property on the open market, pay off the mortgage, and retain the remaining equity rather than go through the foreclosure process. This prevents the "distressed sale" downward spiral that destroys neighborhood property values.
Inventory Dynamics and the Supply-Demand Imbalance
Market analysts point to the weekly new listings data as the most reliable indicator of a potential credit bust. If homeowners were truly struggling at a systemic level, the market would see a surge in new listings as people attempted to exit their debt. However, for the past five years, the U.S. has experienced the lowest new listing volumes in recorded history. This trend has persisted regardless of whether mortgage rates were at 3% or 8%.
The "lock-in effect" has further constrained supply. Many homeowners currently hold mortgage rates below 4%, making them reluctant to sell and move into a new property with a higher rate. This lack of supply continues to put upward pressure on prices, even in the face of reduced affordability. Without a massive surge in supply—which would take years to materialize through the slow legal process of foreclosure—a national nominal home price crash remains highly unlikely.
Economic Implications and Wage Growth
The health of the housing market is inextricably linked to the labor market. Unlike the previous crisis, where unemployment spiked as the housing market failed, the current economy is characterized by high employment and consistent wage growth. For a homeowner with a 30-year fixed-rate mortgage, inflation and wage growth actually make the debt more manageable over time. While the mortgage payment remains static, the borrower’s income generally increases, reducing the percentage of monthly income dedicated to housing costs.
Furthermore, the "foreclosure process" itself is lengthy. It typically involves a series of late notices at 30, 60, 90, and 120 days, followed by a formal notice of default. Even after a default notice is filed, it can take months or even years for a property to be sold at auction or become Real Estate Owned (REO) by a bank. The data currently shows no significant accumulation in the early stages of this pipeline that would suggest a looming wave of market-ready distressed inventory.
Broader Impact and Market Outlook
While individual cases of financial hardship are real and rising foreclosure rates in certain localized markets warrant observation, the national "foreclosure crisis" narrative lacks empirical backing. The structural foundations of the 2024 housing market—high equity, strict lending standards, and low inventory—serve as a robust defense against a systemic collapse.
For potential homebuyers and investors, the primary challenge remains affordability and inventory rather than an impending crash. The transition of foreclosure data back toward pre-2020 levels should be interpreted as a sign of a normalizing legal and financial system rather than an omen of economic doom. As the market continues to adjust to a higher-interest-rate environment, the stability of the American homeowner, backed by nearly two decades of legislative protection and equity accumulation, remains a cornerstone of the broader economy. Analysis of the New York Fed and ATTOM data suggests that while the "doom" narrative may gain traction in headlines, the reality of the data points toward continued, albeit slow, stability in the residential real estate sector.
