

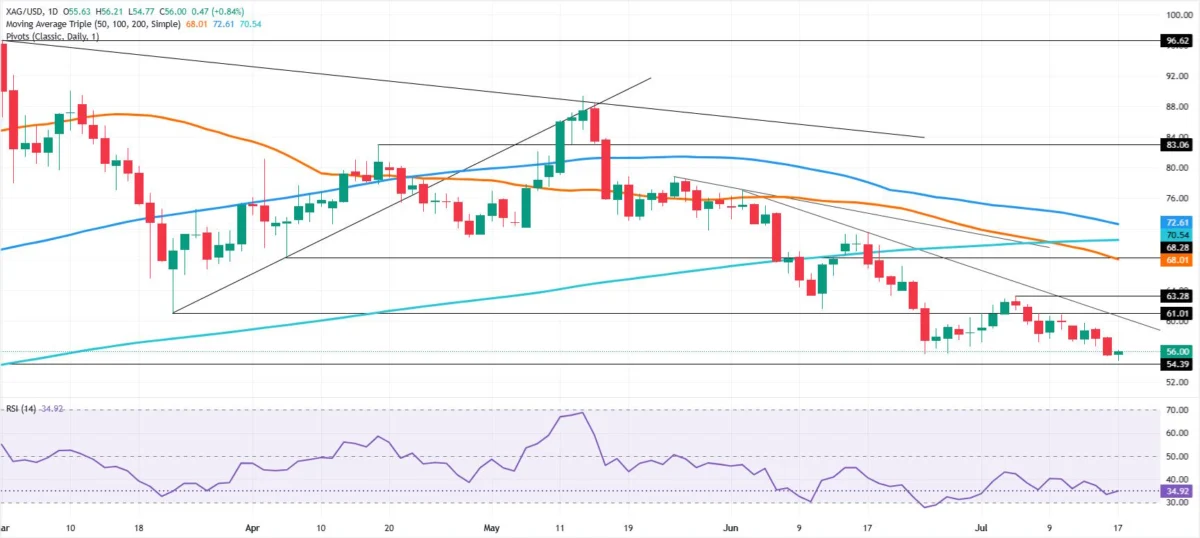
The global precious metals market witnessed a significant downturn for silver this past week, as the white metal concluded trading on Friday with a modest recovery of 0.84% but remained poised to register a substantial weekly loss exceeding 6.50%. This sharp decline pushed XAG/USD to a new year-to-date (YTD) low of $54.77 per troy ounce before staging a minor rebound to trade at $56.00 at the close of the week. The persistent downward pressure underscores a challenging environment for silver, influenced by macroeconomic headwinds and shifting market sentiment.
A Week of Decline: Chronology of Silver’s Downturn
The week began with silver already under considerable pressure, continuing a trend observed over the preceding weeks. Early Monday trading saw XAG/USD fail to decisively reclaim the critical psychological barrier of $60.00 per troy ounce. This failure was a pivotal moment, as a sustained breach above this level could have signaled a potential recovery and opened the path towards challenging the July 6 high of $63.28. Instead, the market reacted negatively, reinforcing the existing bearish sentiment.
Throughout the mid-week, selling pressure intensified, pushing silver prices steadily lower. Factors such as a strengthening US Dollar, evolving expectations for global interest rates, and concerns over industrial demand contributed to the accelerated decline. The downward momentum culminated in XAG/USD breaching several support levels, eventually hitting its new YTD low of $54.77. This marked a significant retreat from its earlier highs and solidified the bearish market structure.
Friday provided a brief respite, with silver prices finding some buying interest and managing a marginal recovery. However, this late-week bounce was insufficient to offset the substantial losses accumulated over the preceding days, leaving investors to grapple with the implications of the largest weekly percentage decline in recent memory. The technical outlook, as depicted by indicators such as the Relative Strength Index (RSI), remains firmly downward-biased, suggesting that the path of least resistance for silver prices continues to be to the downside.
Macroeconomic Headwinds and the Strengthening Dollar
The primary driver behind silver’s recent struggles can be largely attributed to the broader macroeconomic landscape, particularly the robust performance of the US Dollar. As a dollar-denominated commodity, silver typically exhibits an inverse relationship with the greenback; a stronger dollar makes silver more expensive for holders of other currencies, thereby dampening demand.
Recent economic data out of the United States, including stronger-than-expected inflation figures and resilient labor market reports, have prompted a hawkish recalibration of monetary policy expectations. The Federal Reserve, facing persistent inflationary pressures, has maintained a firm stance on potentially higher-for-longer interest rates. This outlook has bolstered the US Dollar Index (DXY), which measures the dollar’s strength against a basket of major currencies, pushing it towards multi-month highs. Investors, seeking higher yields in dollar-denominated assets, have flocked to the greenback, further suppressing demand for non-yielding assets like silver.
Beyond the US, global economic uncertainties also play a crucial role. Concerns over a potential slowdown in major economies, particularly China and the Eurozone, have amplified risk aversion. While silver traditionally serves as a safe-haven asset during times of economic distress, its dual role as an industrial metal means it is also highly susceptible to declines in global manufacturing and industrial activity. The current environment presents a complex interplay where safe-haven demand is often overshadowed by the dollar’s strength and industrial demand concerns.
Industrial Demand Concerns: A Key Drag on Silver
Unlike gold, which is predominantly an investment and store-of-value asset, silver’s price is heavily influenced by its industrial applications. Approximately half of annual silver demand comes from industrial uses, spanning sectors such as electronics, solar energy, automotive, and medical technologies. Silver’s unparalleled electrical conductivity, thermal conductivity, and reflectivity make it indispensable in these fields.
However, the global economic slowdown, exacerbated by geopolitical tensions and supply chain disruptions, has cast a shadow over industrial demand forecasts. Major manufacturing hubs, notably China, have reported softer economic indicators, including subdued factory output and manufacturing Purchasing Managers’ Index (PMI) readings. Given China’s significant role as a consumer of industrial metals, any deceleration in its economic growth directly translates into reduced demand for silver.
The solar energy sector, a significant growth driver for silver consumption in recent years, also faces potential headwinds. While the long-term outlook for renewable energy remains robust, short-term fluctuations in government subsidies, project financing, and manufacturing capacities can impact demand. Similarly, the electronics industry, which utilizes silver in everything from smartphones to circuit boards, is sensitive to consumer spending patterns and global supply chain stability. A slowdown in consumer electronics sales, for instance, can quickly ripple through to silver demand.
Technical Outlook and Key Price Levels
From a technical perspective, silver’s recent price action reinforces a bearish bias. The failure to reclaim the $60.00 psychological barrier was a critical indicator for market participants. This level, once considered a potential springboard for recovery, now acts as a formidable resistance.
The immediate technical support for XAG/USD is identified around the $55.00 mark. Should this level fail to hold, the next significant support zone is found at $54.39, which corresponds to a previous daily high-turned-support from November 13, 2023. A breach below this point would signal further weakness and could open the door for a test of the November 21, 2023, swing low of $48.64. This level represents a critical long-term support, and its breach would indicate a much deeper and more protracted downtrend.
On the upside, a sustained recovery would require XAG/USD to first reclaim and hold above the $60.00 mark. Success at this level could then pave the way for a challenge of the July 6 swing high at $63.28. Further strength beyond this point would target the $65.00 resistance level, followed by the 50-day Simple Moving Average (SMA), currently situated around $68.01. The 50-day SMA often acts as a dynamic resistance or support level, and a break above it would be a strong bullish signal. However, with the Relative Strength Index (RSI) indicating downward momentum, the immediate technical picture remains challenging for silver bulls.
Analyst Reactions and Broader Market Implications
Commodity strategists and market analysts have largely attributed silver’s recent decline to a "perfect storm" of factors. "The relentless strength of the US dollar, coupled with revised expectations for Federal Reserve policy, has created a significant headwind for all dollar-denominated commodities, and silver is no exception," commented a senior analyst at a major investment bank. "Furthermore, the growing concerns about a slowdown in global industrial activity, particularly in key manufacturing economies, are dampening the demand outlook for silver, given its extensive industrial applications."
Another expert from a prominent precious metals consultancy noted, "While gold has also faced pressure, silver’s higher industrial exposure makes it more vulnerable during periods of economic uncertainty. The Gold/Silver ratio has been widening, indicating that silver is underperforming gold, which suggests a shift in investor preference towards gold’s purer safe-haven characteristics." The Gold/Silver ratio, which measures the number of ounces of silver required to buy one ounce of gold, often provides insights into the relative valuation of the two metals. A rising ratio typically implies silver is undervalued relative to gold, or that gold is seen as a safer bet in the current environment.
The implications for investors are multi-faceted. Those holding physical silver or silver-backed ETFs are experiencing significant portfolio depreciation. For industrial users, the lower prices might offer some relief on input costs, but this is likely overshadowed by the broader concerns of reduced end-user demand. The current market dynamics underscore the importance of diversification within a precious metals portfolio, with some investors potentially re-evaluating their exposure to silver in favor of gold, which tends to exhibit less volatility due to its lower industrial dependency.
The Road Ahead: What Could Trigger a Reversal?
For silver to stage a meaningful recovery, several key factors would likely need to shift. A weakening of the US Dollar, perhaps driven by a dovish pivot from the Federal Reserve or improving economic prospects outside the US, would remove a significant headwind. Any signs of robust global economic recovery, particularly in industrial powerhouses like China, would rejuvenate industrial demand for silver. Increased investment demand, potentially triggered by escalating geopolitical tensions or a resurgence of inflation fears, could also provide support.
Conversely, a continued strengthening of the dollar, further interest rate hikes, or a deeper global recession could exacerbate silver’s downward trajectory. Investors will be closely watching upcoming economic data releases, central bank pronouncements, and geopolitical developments for any clues regarding the future direction of the white metal. The path ahead for silver remains fraught with uncertainty, with macroeconomic forces and industrial demand dynamics continuing to dictate its near-term fortunes.
