

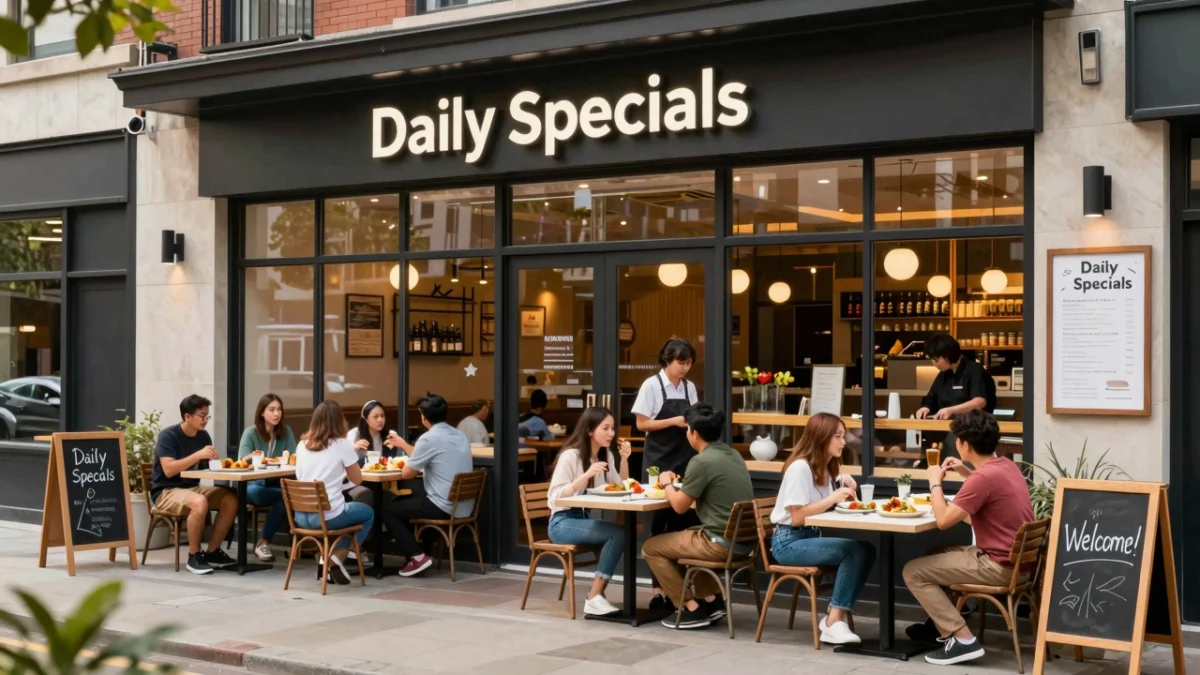
The quick-service restaurant (QSR) and fast-casual sectors have entered a new era of data-driven expansion, where the traditional markers of success are being redefined by a sophisticated blend of technological integration, operational precision, and evolving consumer psychology. As the industry moves through 2026, the distinction between a stable investment and a high-growth powerhouse lies in a franchise’s ability to balance Average Unit Volume (AUV) with sustainable net profit margins. For prospective investors and industry analysts, understanding these metrics is no longer optional but foundational to navigating a market characterized by high labor costs and intense digital competition.

The Pillars of Modern Franchise Success
The primary metric of health for any restaurant franchise remains the Average Unit Volume (AUV). This figure represents the total sales generated by a single location over a year, providing a snapshot of the brand’s market demand and operational throughput. In the current market, Chick-fil-A continues to set the industry benchmark with an unparalleled AUV of approximately $7.5 million per location. This figure is particularly striking given that the brand operates only six days a week, suggesting a level of efficiency and brand loyalty that outpaces competitors with 24/7 operations.
However, high revenue does not always equate to high profitability. A critical analysis of the sector reveals a profit margin paradox: brands with AUVs exceeding $3 million often face complex operational overheads that can compress net margins to the 5% to 7% range. Conversely, simpler operational models—such as those found in the sandwich or specialized snack sectors—can achieve net margins as high as 18% on a more modest AUV of $1.2 million. The most successful franchises in 2026 are those that optimize the "sweet spot" between high volume and lean operations.

Key Financial Metrics for Rigorous Evaluation
Evaluating a franchise opportunity requires a deep dive into Earnings Before Interest, Taxes, Depreciation, and Amortization (EBITDA). This metric provides a clear view of a business’s operational profitability by stripping away the effects of financing and accounting decisions. Industry experts suggest that a healthy franchise should aim for an EBITDA margin between 12% and 20%. Top-tier brands frequently exceed the 18% threshold, indicating superior cost management and supply chain efficiency.
In addition to EBITDA, the following financial benchmarks are essential for assessing long-term viability:

- Initial Investment and Buildout Costs: Entry points vary wildly, from $50,000 for vending or mobile models to over $2 million for full-scale QSR builds. The Great Greek Mediterranean Grill, for instance, typically requires an investment exceeding $300,000, reflecting the costs of prime real estate and high-end kitchen equipment.
- Cash-on-Cash Returns: Investors should target a return of 20% to 35%. This metric measures the annual cash flow relative to the amount of cash initially invested, serving as a primary indicator of how hard the investor’s capital is working.
- Payback Period: In the 2026 economic climate, a 2-to-4-year payback period is considered the industry gold standard. Franchises that take longer to recoup initial capital may pose higher risks in an environment of fluctuating interest rates.
- The 30/30/30 Rule: A classic but effective framework for restaurant health, suggesting that 30% of revenue should go toward food costs (COGS), 30% toward labor, and 30% toward occupancy and operating expenses, leaving 10% as pure profit.
A Chronology of Industry Evolution: 2020–2026
The current state of the franchise market is the result of a rapid six-year evolution triggered by global shifts in consumer behavior.
- 2020–2022: The Delivery Pivot: The pandemic forced an immediate reliance on third-party delivery services. While this sustained revenue, it highlighted the "margin drain" caused by high commission fees, prompting brands to develop in-house delivery capabilities.
- 2023–2024: The Labor Crisis and Automation: Faced with a shrinking labor pool and rising minimum wages, franchises began investing heavily in kiosks and automated kitchen assistants. Brands like White Castle and Chipotle began testing robotic fry stations and prep tools.
- 2025: The Year of the "Small-Footprint" Model: High real estate costs led to the rise of drive-thru-only and "ghost kitchen" prototypes. Starbucks and Taco Bell led the charge with locations designed exclusively for digital pickup.
- 2026: The AI Integration Era: Today, AI-driven predictive ordering and personalized loyalty programs are standard. Data is used to forecast prep needs, reducing food waste and optimizing labor schedules in real-time.
The Role of Brand Power and Customer Loyalty
Brand power in 2026 is measured by digital sentiment and the "repeat customer" index. A strong brand identity does more than just attract new diners; it lowers the cost of customer acquisition. Raising Cane’s has demonstrated this effectively by maintaining a hyper-focused menu that ensures speed and consistency, which in turn fosters a cult-like following.

The impact of digital reputation on revenue is now quantifiable. Market research indicates that a one-star increase on platforms like Yelp or Google Reviews can lead to a 5% to 9% increase in top-line revenue. Consequently, the most successful franchisees are those who treat their online reputation as a critical asset, engaging with feedback and leveraging social proof to drive foot traffic.
Digital Marketing as a Revenue Catalyst
In an era where 63% of urban restaurant traffic is driven by delivery and mobile apps, digital marketing has moved from a supporting role to the primary driver of growth. Successful franchises are now allocating 5% to 10% of gross revenue toward targeted digital strategies.

The focus has shifted from broad awareness to "high-intent" conversion. This includes:
- Hyper-Local SEO: Ensuring the franchise appears in "near me" searches with updated hours, menus, and promotions.
- AI-Enhanced Email Campaigns: Utilizing automated tools to send personalized offers based on previous ordering habits. These tools have been shown to increase conversion rates from an industry average of 3.9% to as high as 6.7%.
- Social Media Engagement: Beyond mere posting, brands are using social platforms for real-time customer service and "viral" product launches, as seen with the rapid expansion of Crumbl Cookies.
Operational Efficiency and the "Lean" Philosophy
Operational efficiency is the engine that converts brand power into profit. The trend toward "lean menus" has proven to be a masterstroke for profitability. By reducing the number of ingredients required, franchises can simplify their supply chain, reduce waste, and decrease training time for new staff. Subway, for example, has seen a resurgence by focusing on core menu strengths and streamlining the assembly process to maintain high throughput during peak hours.

Furthermore, technology-enabled labor management is helping owners navigate the complexities of modern employment. Automated scheduling tools that sync with real-time sales data allow managers to adjust staffing levels on the fly, ensuring that labor costs remain aligned with actual demand.
Analyzing the Top Performers of 2026
The following brands represent the pinnacle of franchise performance in the current market:

- Chick-fil-A: Despite its selective operator model and Sunday closures, it remains the dominant force in QSR, with systemwide sales exceeding $22 billion.
- McDonald’s: With a global footprint of over 13,000 U.S. locations and an AUV of nearly $4 million, its "Accelerating the Arches" strategy—focusing on core menu items and digital sales—continues to pay dividends.
- Raising Cane’s: Boasting an AUV of $6.56 million, its success is attributed to operational simplicity and a focused menu that allows for extreme speed of service.
- Domino’s Pizza: A tech company that happens to sell pizza, Domino’s leverages proprietary logistics software to maintain a dominant share of the delivery market, generating $9.5 million in systemwide sales.
- Crumbl Cookies: Representing the "snack" category, its rotating menu and social media-first marketing have allowed it to achieve a high AUV of $1.84 million with a relatively small physical footprint.
Future Outlook: Sustainability and Innovation
Looking toward the late 2020s, the trajectory of franchise profitability will be dictated by two main factors: sustainability and hyper-personalization. Consumers are increasingly favoring brands that demonstrate environmental responsibility, from packaging to ingredient sourcing. Franchises that can integrate sustainable practices without significantly inflating COGS will likely capture a larger share of the Gen Z and Millennial markets.
Moreover, the "smart" restaurant will continue to evolve. We can expect to see further integration of biometrics for payments and even more advanced AI that can predict a customer’s order before they reach the kiosk. For the franchise owner, this means the role is shifting from a traditional "restaurant manager" to a "data-driven business operator."

Broader Impact and Implications for the Economy
The success of these restaurant franchises has broader implications for the national economy. As these brands grow, they drive significant demand in the commercial real estate sector, particularly for locations with high drive-thru potential. They also serve as a barometer for consumer spending habits; a shift toward value-based franchises often signals a tightening of household budgets, while growth in "premium" QSR brands suggests consumer confidence.
For the aspiring entrepreneur, the message of 2026 is clear: the most profitable path lies in selecting a brand that pairs a powerful identity with a rigorous, tech-forward operational model. By focusing on the critical metrics of AUV, EBITDA, and digital engagement, investors can mitigate the inherent risks of the hospitality industry and secure a position in the next generation of successful restaurant franchising.
