

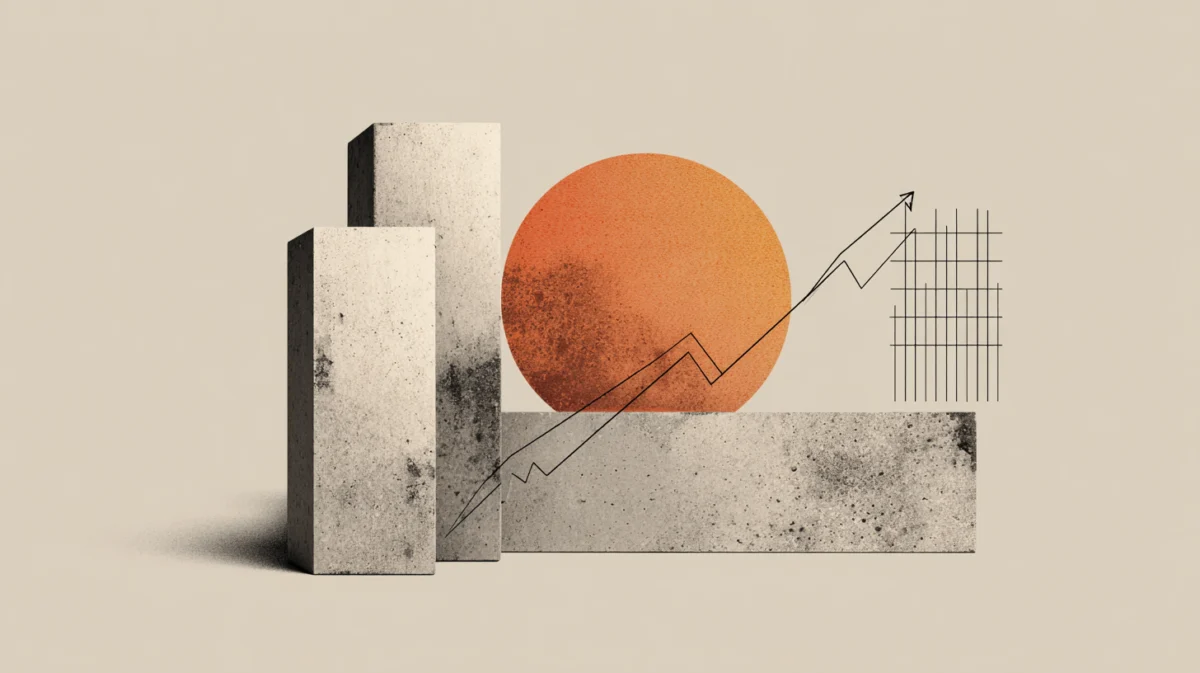
Silver (XAG/USD) extended its significant downtrend on Friday, shedding over 1% of its value to hit a fresh yearly low of $53.03. This pronounced decline has intensified bearish sentiment, positioning the precious metal to potentially test the crucial psychological support level of $50.00 in the near future. As of writing, XAG/USD is trading around $54.00, reflecting the persistent selling pressure that has characterized its recent performance in a challenging macroeconomic environment.
Chronology of the Downtrend and Recent Price Action
The current yearly low marks a critical juncture in Silver’s price trajectory, culminating a period of sustained bearish momentum that has accelerated over recent weeks. Friday’s session saw XAG/USD open near $54.50 before steadily ceding ground throughout the trading day, ultimately breaching prior support levels to establish its lowest point of the year. This latest leg down follows a volatile week for commodities, where Silver has struggled to find a footing amidst broader market headwinds.
Earlier in the year, Silver had shown glimmers of strength, particularly in anticipation of potential interest rate cuts by major central banks and an improving global industrial outlook. Prices briefly rallied, touching highs above $60.00 in the preceding months, fueled by hopes of a soft landing for the global economy and increasing demand from key sectors like solar energy. However, these optimistic projections have largely been undermined by persistent inflation, resilient economic data in the United States, and a hawkish stance from the Federal Reserve. The metal has been gradually eroding gains made earlier in the year, with the downtrend intensifying over the past few weeks as macroeconomic uncertainties have mounted. Key resistance levels, such as the $55.00 mark, which previously offered some consolidation, have now been decisively broken, signaling a clear shift in market control towards sellers. The move below $53.50 on Friday further confirmed this bearish dominance, paving the way for the test of the previous year-to-date low at $53.05 before hitting the new $53.03 low. This consistent erosion of support levels indicates a market grappling with fundamental shifts in investor sentiment and economic realities.
Technical Outlook: Intensifying Bearish Signals
From a technical perspective, the extended downtrend appears firmly entrenched, with the breach of the previous year-to-date low reinforcing the bearish narrative. Analysts are closely monitoring key indicators for signs of exhaustion or reversal, but current readings suggest further downside potential.
The Relative Strength Index (RSI), a momentum oscillator, is currently deep in bearish territory and nearing oversold conditions. An RSI reading below 30 typically indicates that an asset is oversold, suggesting that selling pressure might be temporarily overextended and a bounce could be imminent. However, in a strong, sustained downtrend, the RSI can remain in oversold territory for prolonged periods without a significant reversal, acting more as a confirmation of bearish strength rather than an immediate reversal signal. This suggests that while a short-term rebound cannot be entirely ruled out as some bargain hunters might enter the market, the underlying momentum strongly favors continued price depreciation as sellers maintain their grip.
Immediate support levels are crucial for monitoring Silver’s next moves. The first line of defense is identified at $53.50. A decisive break below this level, which occurred on Friday, typically exposes the next significant floor. The recent YTD low of $53.05, now eclipsed by $53.03, serves as a recent reference point for strong selling interest. Should the price fall further, the psychological barrier of $50.00 looms large. This round number often acts as a significant support or resistance level due to its prominence in market psychology and its historical significance. A breach of $50.00 would represent a substantial psychological blow to bullish sentiment and could trigger further capitulation.
Beyond $50.00, technical analysts are eyeing a significant swing low observed in November 2023, situated at $48.64. This historical price point could offer a more robust level of support if the bearish momentum persists, as it represents a prior area where buying interest previously emerged. Further down, the October 28, 2023, swing low at $45.56 represents another critical area of interest, marking a potential deep correction if the market remains under severe pressure. These historical levels provide benchmarks for potential reversal points, but their efficacy depends on the strength of future buying interest.
For any hopes of a bullish reversal to materialize, Silver must first reclaim and sustain a position above the $55.00 level. Surpassing this immediate resistance would be the first tangible sign of buyers attempting to regain control. A successful move past $55.00 could then set the stage for a challenge of the October 22 high of $58.02. A more substantial recovery would require a push towards the significant psychological and technical milestone of $60.00, a level that would indicate a material shift in market sentiment and potentially signal the end of the current downtrend. Achieving these resistance breaks would require a significant catalyst, likely from a shift in macroeconomic policy or a surge in demand.
Macroeconomic Headwinds: The Driving Force Behind Silver’s Decline
Silver’s recent struggles are not isolated but are deeply intertwined with broader macroeconomic trends, particularly the strength of the US Dollar and the global interest rate environment. These factors collectively create a challenging landscape for non-yielding commodities.
US Dollar Strength and Monetary Policy: One of the most significant factors exerting downward pressure on Silver, like many dollar-denominated commodities, is the persistent strength of the US Dollar (USD). The Dollar Index (DXY), which measures the USD against a basket of six major currencies, has remained robust, hovering near multi-month highs. This strength is largely attributable to the Federal Reserve’s relatively hawkish stance compared to other major central banks. Expectations of higher-for-longer interest rates in the United States, fueled by resilient inflation data and a surprisingly strong labor market, have bolstered the Dollar’s appeal. For instance, while other central banks like the European Central Bank (ECB) have begun or are contemplating rate cuts, the Fed has maintained its benchmark federal funds rate target range at 5.25%-5.50%, signaling a cautious approach to easing. A stronger Dollar makes commodities like Silver more expensive for international buyers holding other currencies, thereby dampening demand and contributing to price declines. The Fed’s commitment to curbing inflation, even if it means maintaining restrictive monetary policy for an extended period, continues to provide a tailwind for the greenback, making it a more attractive asset than precious metals.
Rising Interest Rates and Opportunity Cost: As a non-yielding asset, Silver becomes less attractive when interest rates rise. Investors can earn higher returns from interest-bearing assets such as government bonds (e.g., US Treasuries offering yields above 4%) or high-yield savings accounts, increasing the opportunity cost of holding precious metals that do not offer a yield or dividend. The current environment of elevated global interest rates, with many central banks still grappling with inflationary pressures, diverts capital away from commodities and towards fixed-income instruments. This shift intensifies selling pressure on Silver. The prospect of further rate hikes or a prolonged period of high rates weighs heavily on the metal’s appeal as a store of value, as the cost of holding it (e.g., storage, insurance, forgone interest) increases.
Inflationary Outlook and Safe-Haven Demand: Silver traditionally serves as a hedge against inflation and a safe-haven asset during times of economic uncertainty. However, the current inflation narrative is complex. While inflation remains above target in many economies, there is a prevailing belief among policymakers and market participants that central banks are making progress in bringing it under control. If investors perceive that inflation is being managed effectively and is trending downwards towards target levels, the urgency to hold inflation hedges like Silver diminishes. Furthermore, while geopolitical tensions persist globally, the immediate flight-to-safety capital flows have often favored Gold over Silver, with Gold’s status as the ultimate safe haven generally more pronounced. Silver’s dual role as an industrial metal makes it more susceptible to economic slowdowns, causing it to underperform Gold during periods when industrial demand is questioned.
Global Economic Slowdown Concerns and Industrial Demand
Beyond monetary policy, growing concerns about a slowdown in global economic growth are significantly impacting Silver due to its substantial industrial applications. Approximately 50-60% of annual Silver demand comes from industrial uses, making it highly sensitive to the health of manufacturing sectors worldwide. This sensitivity means that economic contractions or even slower growth rates in key industrial regions can have a disproportionate effect on Silver prices.
Key Industrial Sectors Affected:
- Electronics: Silver’s exceptional electrical conductivity and thermal conductivity make it indispensable in a vast array of electronics, including circuit boards, semiconductors, electrical contacts, and switches. A contraction in global consumer electronics demand, which has been observed in recent quarters due to economic pressures and saturation in some markets, directly reduces Silver consumption. The demand for smartphones, computers, and other gadgets, while robust in the long term, faces cyclical downturns.
- Solar Energy: The rapidly expanding solar photovoltaic (PV) industry is a major and growing driver of Silver demand, using it in solar cells to convert sunlight into electricity. The Silver paste used in these cells is crucial for efficiency. While the long-term outlook for solar remains strong, driven by global climate change initiatives and government subsidies (e.g., the Inflation Reduction Act in the US), short-term disruptions, supply chain issues, or policy uncertainties in major markets like China and Europe can affect demand. Despite impressive growth rates in solar panel installations, a slight deceleration or oversupply in panel production could impact Silver usage.
- Automotive: Modern vehicles, particularly electric vehicles (EVs), incorporate increasing amounts of Silver in various electronic components, switches, conductive pastes, and battery connections. EVs, with their advanced electronic systems, use significantly more Silver than traditional internal combustion engine vehicles. A slump in global automotive production, which has faced challenges from chip shortages to supply chain disruptions, or slower-than-expected EV adoption rates due to charging infrastructure concerns or high costs, could dampen Silver demand from this critical sector.
- 5G Technology: The ongoing global rollout of 5G infrastructure requires significant amounts of Silver in connectors, components, and solder. Delays or scaling back of network expansions, or a slower pace of new device adoption, could impact demand.
- Medical and Photography: While less dominant than in the past, Silver still finds uses in medical applications (antibacterial properties) and niche photographic uses, which contribute to its overall demand profile.
Geographic Demand Drivers: Major industrial economies such as the United States, China, and Germany are critical for Silver’s industrial demand. China, in particular, is a behemoth in manufacturing and a key consumer of industrial metals. Any signs of weakness in the Chinese economy, such as slowing factory output, property sector woes, or reduced consumer spending, reverberate through the commodities market, including Silver. Recent manufacturing Purchasing Managers’ Index (PMI) data from China has shown volatility, indicating an uneven recovery. Similarly, manufacturing data from the US and Europe are closely watched indicators; softening in these regions points to reduced industrial activity. In India, consumer demand for Silver in jewelry and silverware also plays a notable role in price dynamics, especially during festival seasons like Diwali and Akshaya Tritiya, which traditionally boost physical demand. A weaker economic outlook in these regions translates directly into lower projected industrial activity and, consequently, reduced Silver consumption.
The Gold-Silver Ratio: A Diverging Performance
The Gold-Silver ratio, which indicates how many ounces of Silver are needed to buy one ounce of Gold, often provides insights into the relative valuation of the two precious metals. Historically, the ratio has fluctuated, with an average often cited around 60:1 or 70:1. A rising ratio typically suggests that Silver is underperforming Gold, or that Gold is relatively overvalued compared to Silver.
In the current environment, the Gold-Silver ratio has generally been trending higher, often exceeding 80:1 or 90:1 in recent periods, indicating that Gold has maintained its safe-haven appeal more effectively than Silver. While both metals are considered safe havens, Gold is often seen as the primary hedge during periods of acute financial stress or geopolitical uncertainty due to its larger market capitalization and stronger historical association with monetary value. Silver, with its significant industrial component, tends to be more volatile and susceptible to economic downturns, making it a "risk-on" precious metal in some market interpretations. This divergence in performance underscores Silver’s dual identity as both a precious metal and an industrial commodity, making it vulnerable to a wider array of market forces than Gold. A high ratio might lead some investors to believe Silver is undervalued relative to Gold, potentially attracting bargain hunters in the long run who anticipate a reversion to the historical mean. However, currently, the market’s focus remains on its immediate downside risks and the factors contributing to its underperformance.
Supply Dynamics and Market Balance
Silver supply primarily comes from mining operations, often as a byproduct of lead, zinc, copper, and gold extraction. This co-production characteristic means its supply is less elastic to its own price movements compared to a primary mined commodity. Global Silver mining output has seen fluctuations, with some years experiencing declines due to mine closures, lower ore grades, or operational challenges in major producing countries like Mexico, Peru, and China. Recycling also contributes significantly to supply, influenced by industrial activity, technological advancements in recovery, and consumer behavior
