

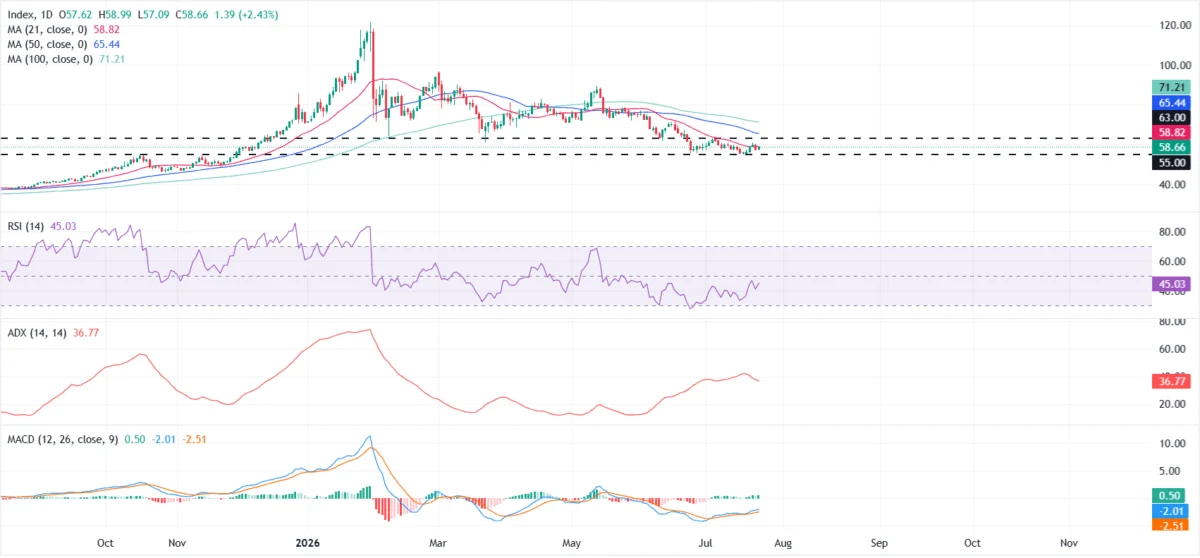
Silver (XAG/USD) experienced an uptick on Friday, recording a 2.40% gain to trade around $58.60, as a notable pullback in crude oil prices exerted downward pressure on US Treasury yields, while the US Dollar (USD) maintained a volatile posture near its recent highs. This move comes as the precious metal grapples with a complex interplay of macroeconomic forces, including persistent inflation concerns and a hawkish Federal Reserve, which continue to temper its upward momentum. Despite the day’s gains, the broader market sentiment remains cautious, with elevated energy costs and high borrowing rates acting as significant headwinds for non-yielding assets like silver.
The Immediate Catalysts: Oil’s Retreat and Yields’ Response
The primary driver for Friday’s silver rally was the softening of oil prices. Crude oil, often viewed as a leading indicator for inflation, saw a significant retreat from its recent peaks. This decline alleviated some of the immediate inflationary pressures perceived by the market, which in turn led to a decrease in US Treasury yields. Lower Treasury yields diminish the attractiveness of holding interest-bearing government bonds, making non-yielding assets such as silver comparatively more appealing. Investors typically seek higher yields to compensate for inflation and the opportunity cost of not investing in growth assets. When yields fall, the opportunity cost for holding silver, which does not offer a coupon or dividend, decreases, potentially boosting its demand.
Simultaneously, the US Dollar’s performance played a crucial role. The dollar, as the denominating currency for silver (XAG/USD), has an inverse relationship with the metal’s price. A stronger dollar makes silver more expensive for international buyers, thus reducing demand and exerting downward pressure on prices. Conversely, a weaker dollar can make silver more affordable, stimulating demand. On Friday, the dollar’s fluctuation near recent highs suggested a complex equilibrium, where its strength was not overwhelmingly deterring silver’s upward movement in the face of falling yields. This intricate dance between oil, yields, and the dollar highlights the multifaceted nature of commodity markets and their sensitivity to shifting macroeconomic narratives.
The Overarching Shadow: Federal Reserve Policy and Inflationary Pressures
Despite the daily reprieve, the broader context for silver remains heavily influenced by the Federal Reserve’s aggressive monetary policy stance and ongoing inflation concerns. The Fed has been on a sustained campaign of interest rate hikes to combat stubbornly high inflation, which has seen consumer price index (CPI) and personal consumption expenditures (PCE) data remain above the central bank’s target of 2%. This hawkish posture has translated into higher borrowing costs across the economy, creating a challenging environment for assets that do not generate income.
According to the CME FedWatch Tool, market participants are pricing in an approximately 80% chance of another rate hike in September. While the Fed is widely expected to keep interest rates unchanged at its upcoming meeting next week, the strong probability of a future hike underscores the central bank’s commitment to tightening monetary conditions. Higher interest rates increase the opportunity cost of holding non-yielding assets like silver, as investors can earn more by holding cash or interest-bearing securities. This dynamic has been a consistent drag on silver prices throughout the current tightening cycle, keeping its upside potential significantly capped. The Fed’s dual mandate of maximum employment and price stability means that until inflation is demonstrably under control, the bias for higher rates is likely to persist, maintaining pressure on precious metals.
Silver’s Technical Crossroads: A Battle for Direction
From a technical standpoint, silver finds itself at a critical juncture, exhibiting signs of stabilization within a defined range but struggling to break free from a broader bearish structure. Since late June, XAG/USD has largely traded between $55 and $63, a range-bound behavior that follows a period of significant decline from its May peak near $90.00. This stabilization, characterized by a cessation of the previous series of lower highs and lower lows, suggests that selling pressure has temporarily abated, and buyers are finding a floor at these levels. However, the current price action indicates a struggle for decisive direction.
The metal is currently encountering significant resistance around its 21-day Simple Moving Average (SMA) at $58.82. The 21-day SMA is often used by traders as a short-term trend indicator, and a struggle to reclaim it suggests that immediate bullish momentum is limited. More critically, the longer-term moving averages—the 50-day SMA at $65.44 and the 100-day SMA at $71.21—remain well above the current price. These longer-term indicators are crucial for identifying the prevailing trend, and their positioning indicates that the broader bearish structure, which has been in place since May’s peak, remains firmly intact. A sustained break above these formidable barriers would be necessary to signal a genuine shift in the market’s underlying sentiment and technical outlook.
Momentum Indicators Paint a Mixed Picture:
- Relative Strength Index (RSI): The RSI, a momentum oscillator that measures the speed and change of price movements, is hovering near 45. A reading below 50 typically suggests subdued momentum, indicating that neither buyers nor sellers are exerting dominant control, aligning with the current range-bound trading.
- Moving Average Convergence Divergence (MACD): The MACD indicator sits slightly above the zero line. While a position above zero is generally considered bullish, its proximity to the line and the "moderate selling pressure" mentioned in the original context suggest that any bullish crossover is tentative and lacks strong conviction. It indicates a fragile balance between buying and selling forces.
- Average Directional Index (ADX): The ADX, which measures the strength of a trend rather than its direction, is near 36. An ADX reading above 25 typically indicates that a trend is strong. The fact that it’s at 36 suggests that the broader bearish trend, as defined by the longer-term SMAs, still retains meaningful strength, reinforcing the view that silver remains under pressure despite short-term fluctuations.
Key Support and Resistance Levels:
- Initial Support: The immediate downside protection for silver lies at the horizontal floor near $55. This level has previously acted as a strong buying zone, where demand stepped in to prevent further declines. A decisive break below $55 would be a significant bearish signal, potentially opening the door for further losses.
- Immediate Resistance: On the upside, bulls face an immediate challenge at the 21-day SMA at $58.82. Reclaiming this level would help alleviate immediate downside pressure and provide some short-term confidence.
- Further Resistance: Beyond the 21-day SMA, significant resistance is located at $63, representing the upper bound of the recent trading range. A breach of this level would be a positive development, followed by the 50-day SMA at $65.44.
- Major Hurdle: The ultimate test for silver bulls lies at the 100-day SMA at $71.21. Only a sustained break above this level, along with the previous resistance barriers, would begin to truly challenge the prevailing bearish structure and potentially signal a reversal to a more constructive long-term outlook.
The Dual Nature of Silver: Industrial Workhorse and Monetary Metal

Silver’s market dynamics are uniquely complex due to its dual identity: it is both an industrial commodity with widespread applications and a precious metal with historical monetary and safe-haven properties. This dual nature means its price is influenced by a diverse set of factors that can sometimes pull in opposing directions.
Industrial Demand: A substantial portion of global silver demand comes from industrial applications. Silver boasts the highest electrical conductivity of all metals, making it indispensable in electronics (e.g., semiconductors, printed circuit boards), solar energy (photovoltaic cells), medical devices, photography, and brazing alloys. Economic growth, particularly in major industrial economies like the United States, China, and increasingly India, directly correlates with industrial demand for silver. A robust global economy typically translates to higher manufacturing output and increased demand for silver, supporting its price. Conversely, fears of a recession or an economic slowdown can significantly curb industrial consumption, placing downward pressure on silver prices. India, for instance, also sees substantial demand for silver in jewelry, which contributes significantly to its price swings.
Investment and Safe-Haven Demand: As a precious metal, silver shares some characteristics with gold, albeit to a lesser extent. It has historically served as a store of value and a hedge against inflation or economic uncertainty. During periods of geopolitical instability or financial market turmoil, investors often flock to precious metals as safe havens, driving up demand. However, silver’s volatility tends to be higher than gold’s, and its safe-haven appeal is generally considered secondary to gold’s. When interest rates are low or negative, and inflation is perceived as a threat, investors may turn to silver as a way to preserve purchasing power, as it is a tangible asset not subject to the same risks as fiat currencies.
Supply Dynamics: The supply side of the silver market is also crucial. Silver is much more abundant than gold, and a significant portion of its supply comes as a byproduct of mining other metals, such as copper, lead, and zinc. This means that silver supply can be less responsive to its own price movements compared to metals primarily mined for their intrinsic value. Recycling rates also play a role, contributing to the overall supply.
The Gold/Silver Ratio: A Barometer for Relative Valuation
The Gold/Silver ratio is a widely watched metric that indicates the number of ounces of silver required to purchase one ounce of gold. This ratio offers insights into the relative valuation of the two precious metals and can be a useful tool for investors seeking to identify potential opportunities.
Historically, the Gold/Silver ratio has fluctuated, often between 50 and 90. A high ratio, for instance, above 80 or 90, suggests that silver is relatively undervalued compared to gold, or conversely, that gold is overvalued relative to silver. Some investors interpret a high ratio as a signal to buy silver, anticipating that it will eventually narrow as silver prices catch up to gold. Conversely, a low ratio might suggest that silver is overvalued or gold is undervalued, prompting investors to consider buying gold.
Currently, with gold prices maintaining higher levels relative to silver’s recent struggles, the ratio has tended to be on the higher side. This implies that silver might be considered relatively cheap compared to its yellow counterpart. However, the ratio is just one factor, and broader market conditions, including central bank policies, inflation expectations, and industrial demand, remain critical in determining both metals’ individual trajectories.
Broader Economic Context and Future Outlook
Silver’s trajectory in the coming months will largely depend on the evolving macroeconomic landscape. The central question revolves around the future path of inflation and the Federal Reserve’s response. If inflation proves more persistent than anticipated, forcing the Fed to maintain or even escalate its hawkish stance, silver is likely to remain under pressure due to the opportunity cost of higher interest rates and a potentially stronger dollar.
Conversely, if inflation begins to show a sustained decline, allowing the Fed to pause or even signal a pivot towards rate cuts in the future, the environment for silver could become more favorable. Lower interest rates would reduce the opportunity cost of holding non-yielding assets, potentially attracting more investment flows into precious metals.
The global economic growth outlook is another critical determinant. A significant slowdown or recession would likely dampen industrial demand for silver, creating headwinds. However, a severe economic downturn might also trigger increased safe-haven demand, partially offsetting the industrial weakness. Geopolitical stability or instability will also continue to influence investor sentiment, with increased tensions typically boosting demand for safe-haven assets.
In conclusion, silver stands at a pivotal point, caught between the immediate bullish impulses from declining oil prices and yields, and the persistent gravitational pull of a hawkish Federal Reserve battling inflation. Its unique dual role as both an industrial metal and a precious metal ensures its sensitivity to a wide array of economic indicators. While technical indicators suggest a struggle within a broader bearish structure, any sustained shift in the macroeconomic narrative, particularly concerning central bank policy or global economic health, could provide the catalyst for silver to either break higher or succumb to further downside pressure. Investors will continue to watch for definitive signals from economic data, central bank communications, and the evolving geopolitical landscape to gauge silver’s path forward.
