
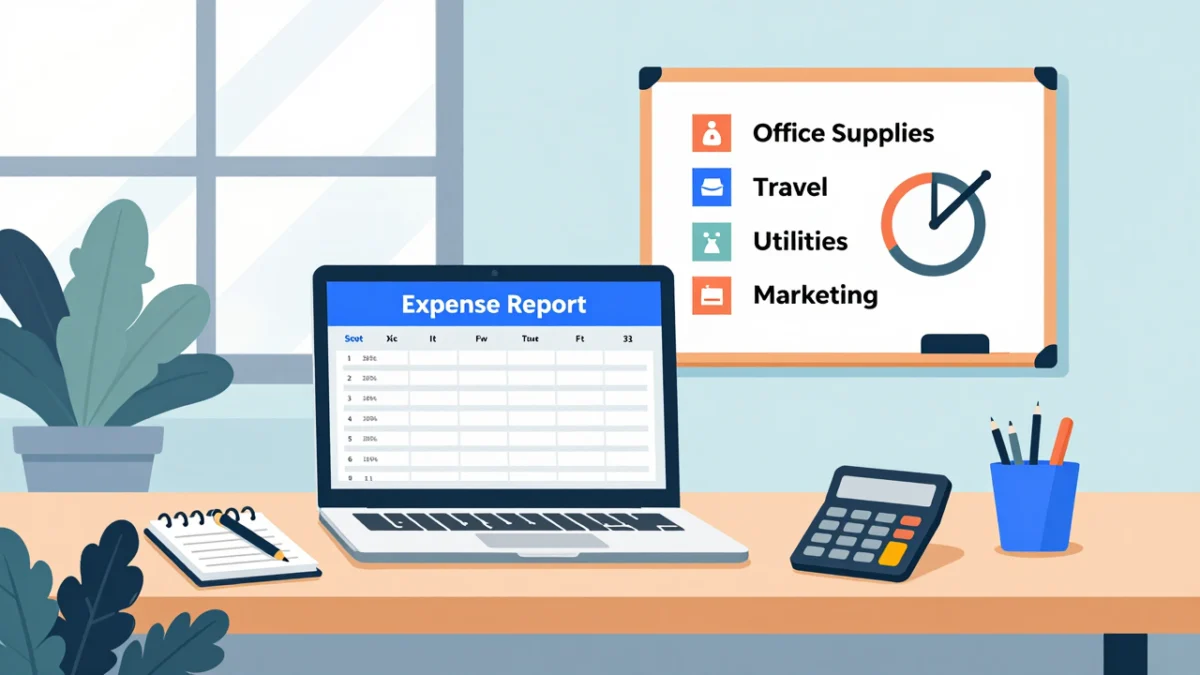
In the complex landscape of modern commerce, the ability of a business to maintain fiscal health is inextricably linked to the precision of its internal accounting structures. Central to this precision is the Chart of Accounts (COA), a foundational organizational tool that categorizes every financial transaction within a company. For small to medium-sized enterprises (SMEs) and large corporations alike, the effective classification of expense categories is not merely a matter of bookkeeping but a strategic necessity that influences tax liability, investor confidence, and operational scalability. By organizing costs into distinct silos—such as direct and indirect expenses, payroll, marketing, and utilities—business leaders gain the granular visibility required to make informed decisions in an increasingly volatile global market.

The Structural Significance of the Chart of Accounts
The Chart of Accounts serves as the "financial DNA" of an organization. It provides a complete listing of every account in an accounting system, typically broken down into five primary categories: assets, liabilities, equity, revenue, and expenses. Within the expense segment, the COA must be meticulously designed to reflect the specific operational realities of the business. According to financial analysts, a poorly structured COA is a leading contributor to "accounting noise," where vital data is buried under redundant sub-accounts or misclassified entries, making it difficult for stakeholders to assess the true cost of doing business.
The Internal Revenue Service (IRS) and other global tax authorities emphasize the importance of maintaining "ordinary and necessary" business expense records. Current federal guidelines recommend that businesses retain documentation, including receipts and ledgers, for a minimum of three years. This period allows for sufficient look-back during potential audits. However, many tax professionals advise a seven-year retention policy to align with the statutes of limitations for more complex financial discrepancies.

A Chronology of Accounting Standards and Digital Transformation
The evolution of expense categorization has moved through several distinct phases. Historically, businesses utilized manual "T-accounts" and physical ledgers, a process that was both labor-intensive and prone to human error. The 1970s and 80s saw the introduction of standardized frameworks such as the Generally Accepted Accounting Principles (GAAP) in the United States and the later development of International Financial Reporting Standards (IFRS) globally. These frameworks provided the first consistent definitions of what constitutes an operating expense versus a capital expenditure.
The 2000s marked a pivot toward digital transformation, with the rise of Enterprise Resource Planning (ERP) software and cloud-based accounting platforms. This shift allowed for real-time tracking of expenses. Today, the integration of Artificial Intelligence (AI) and Machine Learning (ML) into accounting software is further refining the COA process. Modern systems can now "predict" the correct category for a transaction based on historical data, significantly reducing the administrative burden on accounting departments.

Categorizing Business Expenditures: Direct vs. Indirect Costs
At the core of expense management is the distinction between direct and indirect costs. Direct costs, often referred to as the Cost of Goods Sold (COGS), are expenditures that can be directly attributed to the production of a specific product or the delivery of a service. For a manufacturer, this includes raw materials and direct factory labor. For a software firm, this might include server costs associated with hosting a client’s platform.
Indirect costs, conversely, are the expenses necessary to keep the business operational but are not tied to a specific unit of output. These are frequently classified as "overhead" and include items such as administrative salaries, rent, and general insurance. Distinguishing between these two is critical for calculating a company’s gross margin. Data from the Small Business Administration (SBA) suggests that firms that fail to accurately track their direct costs often struggle with pricing strategies, leading to "growth-induced bankruptcy" where increased sales actually accelerate financial losses due to negative margins.

The Pillars of Operating Expenses (OPEX)
Operating expenses represent the daily costs of running a business. These are typically categorized into several essential buckets:
- Payroll and Human Capital: This is often the largest expense for service-based businesses. It encompasses not only base salaries and wages but also payroll taxes, health insurance premiums, 400(k) contributions, and bonuses. Experts note that as remote work becomes a permanent fixture, the "Payroll" category is expanding to include stipends for home offices and regional tax adjustments for distributed workforces.
- Administrative and General (G&A): These are the costs of the "back office." Utilities, office supplies, legal fees, and accounting services fall under this umbrella. While these costs are often viewed as "fixed," proactive management can identify significant savings. For example, the shift toward paperless environments has seen "office supply" expenditures drop by an average of 15% in the professional services sector over the last decade.
- Marketing and Advertising: In a competitive digital economy, marketing is a primary driver of growth. These expenses include digital ad spend (PPC), social media management, SEO services, and traditional media buys. Financial benchmarks suggest that high-growth companies typically allocate between 5% and 10% of their total revenue to marketing. During economic downturns, this is often the first category to see cuts, though analysts warn that excessive reductions in marketing spend can lead to a long-term loss in market share.
- Research and Development (R&D): For technology and pharmaceutical firms, R&D is a vital expense category. It covers the costs of innovation, including prototyping, testing, and software development. Under current tax laws, certain R&D expenses qualify for tax credits, providing a significant incentive for companies to invest in new intellectual property.
The Role of Travel and Entertainment in Tax Compliance
Travel and entertainment (T&E) expenses remain one of the most scrutinized areas by the IRS. These include airfare, lodging, and meals incurred while conducting business away from the company’s primary location. Historically, "entertainment" was largely deductible, but recent tax reforms have limited these deductions, focusing instead on "business meals" under specific conditions.

To maintain compliance, businesses must ensure that T&E expenses are documented with the "who, what, where, and why" of each transaction. The use of corporate credit cards integrated with expense management software has become the industry standard for tracking these costs, providing a digital paper trail that simplifies the reconciliation process at the end of each fiscal month.
Strategic Implications and Financial Analysis
The broader impact of a well-organized Chart of Accounts extends beyond the accounting department. It is a critical tool for strategic financial analysis. By comparing expense categories against revenue over time, CFOs can perform "vertical analysis," which expresses each expense as a percentage of total sales. This allows leadership to identify "creep" in specific categories, such as an unexplained rise in utility costs or a sudden spike in shipping fees.

Furthermore, accurate expense categorization is vital during the due diligence process of a merger or acquisition. Prospective buyers look for "clean" books where expenses are clearly delineated. If a business owner has commingled personal expenses with business accounts—a common pitfall in small business management—it can significantly devalue the company or even scuttle the deal entirely.
Expert Perspectives on Best Practices
Financial consultants and Certified Public Accountants (CPAs) emphasize that a Chart of Accounts should be "lean yet descriptive." One of the most common mistakes is creating a new account for every unique vendor. Instead, experts recommend using "custom fields" or "tags" within accounting software to track vendor-specific data while keeping the primary COA categories general.

"The goal is to provide a snapshot that a CEO can understand in five minutes," says a leading financial advisor. "If the expense list is ten pages long, it’s no longer a management tool; it’s just a list of transactions. You need to group costs in a way that highlights the levers you can actually pull to improve profitability."
Conclusion: The Path Toward Sustainable Growth
As the global economy shifts toward more complex, service-oriented, and digital models, the importance of robust financial categorization will only increase. A well-structured Chart of Accounts provides the clarity needed to navigate economic cycles, ensuring that a business can identify cost-saving opportunities without compromising its core mission. By adhering to standardized categories, maintaining meticulous documentation, and leveraging modern financial technology, organizations can transform their accounting from a reactive back-office function into a proactive driver of sustainable growth and long-term financial stability. In the final analysis, the businesses that survive and thrive are those that not only understand what they are earning but have a masterly command over exactly what they are spending.
