

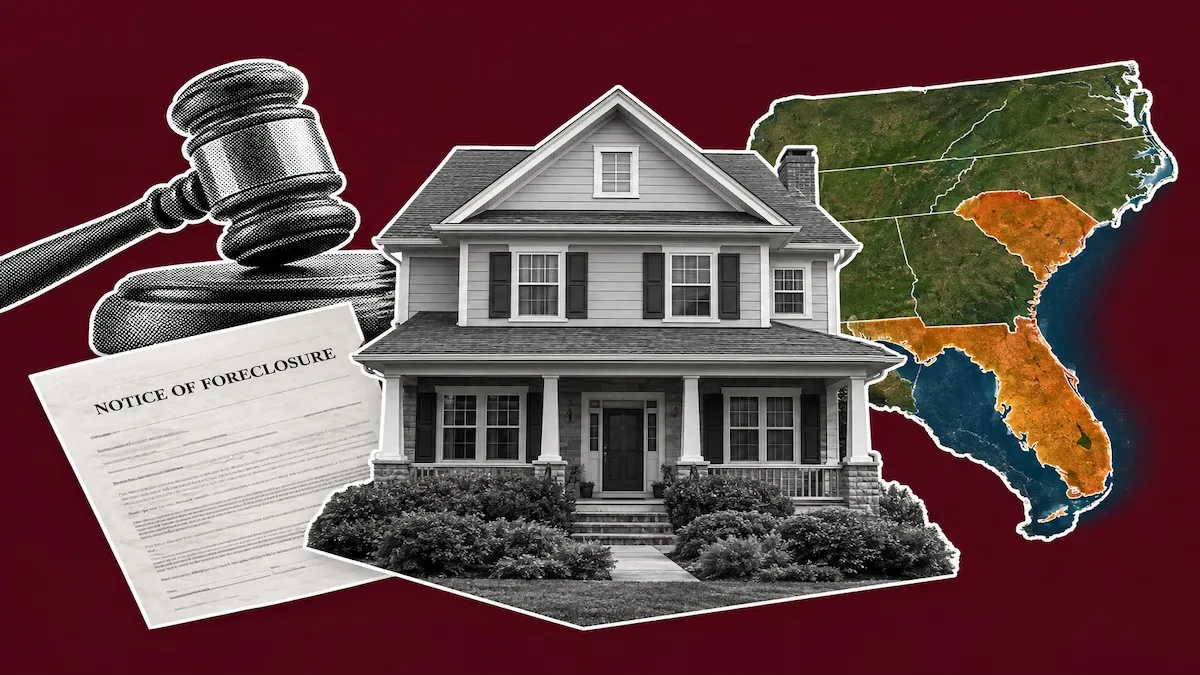
The United States real estate market witnessed a notable shift in distressed property activity during August 2026, as foreclosure filings reached their highest levels in recent years. According to the latest U.S. Foreclosure Market Report released by ATTOM, a leading curator of land and property data, a total of 40,277 U.S. properties were subject to foreclosure filings last month. These filings, which encompass default notices, scheduled auctions, and bank repossessions (REOs), represent a 1% increase from July 2026 and a more substantial 13% rise compared to August 2025. This uptick underscores a continuing trend of normalization in the housing market as the remnants of pandemic-era protections fade and the economic landscape of the mid-2020s takes hold.
The data reveals a multifaceted picture of the American housing sector. While the raw number of filings suggests growing pressure on certain segments of the population, industry experts emphasize that the current figures must be viewed within a broader historical context. Rob Barber, CEO of ATTOM, noted that while foreclosure activity is trending above levels seen 12 months ago, the market is not currently mirroring the catastrophic collapse seen during the Great Recession. The increase is particularly evident in completed foreclosures, which saw a significant annual jump, indicating that the legal and administrative backlogs that previously stalled these proceedings are finally clearing.
National Foreclosure Rates and Geographic Concentrations
On a national scale, the foreclosure rate in August 2026 stood at one in every 3,569 housing units. While this indicates a relatively stable environment for the vast majority of American homeowners, specific regions are experiencing much higher concentrations of distress. The burden of foreclosure activity is not evenly distributed, with several states in the South and West emerging as hotspots for filing activity.
South Carolina held the distinction of having the highest state foreclosure rate in the country for August. The state recorded one foreclosure filing for every 1,547 housing units, a rate more than double the national average. Following South Carolina were Nevada (one in 1,920 units), Florida (one in 2,397 units), Texas (one in 2,445 units), and Maryland (one in 2,530 units). The prevalence of Southern states in this list highlights a shift in market dynamics, as these regions—previously magnets for migration and rapid price appreciation—now face the reality of high interest rates and localized economic cooling.
When narrowing the focus to major metropolitan areas with populations of at least 200,000, the data further emphasizes the regional nature of the foreclosure trend. Columbia, South Carolina, reported the highest foreclosure rate among large metros, with one filing for every 1,232 housing units. Other cities facing significant pressure included Punta Gorda, Florida (one in 1,249); Spartanburg, South Carolina (one in 1,262); Fayetteville, North Carolina (one in 1,458); and Charleston, South Carolina (one in 1,501). The dominance of South Carolina municipalities in these rankings suggests that specific state-level economic factors or legal processing speeds may be contributing to the accelerated rate of filings in the Palmetto State.
Foreclosure Starts: A Mixed Signal for the Market
A critical component of the ATTOM report is the tracking of foreclosure "starts"—the initial step where lenders formally begin proceedings against a delinquent borrower. In August 2026, lenders initiated foreclosure proceedings on 25,894 U.S. properties. This figure represented a 3% decrease from July 2026, providing a momentary reprieve from monthly growth. However, when compared to August 2025, foreclosure starts were up 7%, signaling a persistent upward trajectory in new distress cases over the long term.
The states with the highest volume of foreclosure starts were primarily those with the largest populations, where the sheer scale of the housing market naturally leads to higher numbers. Florida led the nation with 3,189 starts, followed closely by Texas with 3,126. California followed with 2,565 starts, while Illinois and Georgia rounded out the top five with ,192 and 1,189 starts, respectively.
Interestingly, several major metropolitan areas bucked the national trend by recording significant year-over-year declines in foreclosure starts. Among metros with populations of at least 200,000 and at least 50 starts, Cleveland, Ohio, saw the most dramatic improvement. The city’s foreclosure starts dropped from 281 in August 2025 to 175 in August 2026. Other cities showing resilience included Washington, D.C. (falling from 364 to 227), Providence, Rhode Island (from 88 to 55), Raleigh, North Carolina (from 81 to 57), and Kansas City, Missouri (from 104 to 75). These localized declines suggest that even as the national average rises, certain regional economies remain robust enough to help homeowners avoid the initial stages of the foreclosure process.
The Surge in Bank Repossessions (REOs)
Perhaps the most striking finding in the August 2026 report is the sharp increase in completed foreclosures, also known as Real Estate Owned (REO) properties. Lenders repossessed 5,794 properties through completed foreclosures during the month. This represents a 22% surge from the previous month and a staggering 42% increase from August 2025.
The spike in REOs indicates that the "pipeline" of distressed properties is moving toward its final stage. Many of the properties currently being repossessed likely entered the foreclosure process months or even years ago, delayed by previous moratoriums or prolonged mediation efforts. As these cases reach their conclusion, the homes are being returned to the lenders’ portfolios, where they will eventually be listed for sale, potentially providing a small boost to the nation’s perennially low housing inventory.
Texas recorded the highest number of repossessions in August with 1,835 properties, a figure far exceeding any other state. California followed with 589 repossessions, while North Carolina (356), Arizona (296), and Alabama (286) also saw significant activity. At the city level, the Texas dominance was even more pronounced. Houston led the nation’s metro areas with 448 completed foreclosures, followed by Dallas (402) and San Antonio (256). Phoenix, Arizona (186) and Baltimore, Maryland (167) also ranked among the top five cities for repossessions.
Historical Context and Economic Implications
To understand the significance of 40,277 foreclosure filings in August 2026, it is necessary to compare these figures with historical benchmarks. During the height of the Great Recession in 2008 and 2009, monthly foreclosure filings frequently exceeded 300,000. By comparison, the current volume remains less than 15% of the peak levels seen during the last major housing crisis.
The primary difference between the 2026 environment and the 2008 crisis is the level of homeowner equity. Despite the rise in filings, most American homeowners currently possess significant equity in their properties due to the rapid home price appreciation seen between 2020 and 2025. This equity serves as a critical safety net, allowing many homeowners who fall behind on payments to sell their homes conventionally and pay off their debts rather than facing a completed foreclosure.
However, the 42% annual increase in repossessions suggests that for a subset of the population, equity is either insufficient or the financial distress is too acute to permit a traditional sale. Factors contributing to this trend include the exhaustion of personal savings, the impact of sustained inflation on household budgets, and a gradual cooling of the labor market in specific sectors.
Analysis of Market Resilience and Future Outlook
The current data reflects a market in transition. The increase in foreclosure activity is often described by economists as a "return to normal" rather than a "market crash." For several years, foreclosure rates were artificially suppressed by federal and state interventions. The current rise represents the market recalibrating to its natural equilibrium.
"While some homeowners are still facing financial challenges, overall foreclosure volumes remain well below historical norms and the broader housing market continues to demonstrate resilience," Rob Barber stated in the report. This resilience is bolstered by strict lending standards implemented over the last decade, which have ensured that the majority of mortgage holders are better qualified than those in the early 2000s.
Looking forward, analysts will be closely monitoring the interplay between interest rates and foreclosure starts. If the Federal Reserve continues to maintain higher rates to combat lingering inflation, the cost of adjustable-rate mortgages and other debt could push more homeowners toward the brink. Conversely, if the economy achieves a "soft landing" and employment remains stable, the foreclosure trend may plateau as the current backlog of cases is cleared.
The geographical concentration of foreclosures in states like South Carolina and Florida also warrants attention. These states have been among the most popular destinations for internal migration in the U.S. If foreclosure rates continue to climb in these growth hubs, it could signal a shift in migration patterns or a correction in home prices that were driven to unsustainable heights by the recent influx of new residents.
In conclusion, the August 2026 ATTOM report provides a clear indication that the U.S. housing market is navigating a period of increased volatility for distressed properties. While the 13% annual increase in filings and the 42% jump in repossessions are significant, they do not yet suggest a systemic threat to the national economy. Instead, they highlight localized areas of concern and a general normalization of the credit cycle. For investors, lenders, and policymakers, these figures serve as a vital barometer for the health of the American dream in an era of shifting economic tides.
